Kotlin daemonology notes
While working on Kotlin/JS, I’ve come across quite a few new things for myself. The Kotlin compiler itself runs on the JVM, launching either within the Gradle daemon or its own Kotlin daemon (which is triggered from the Gradle daemon). In this post, I’ve compiled my key notes, command-line snippets, and general thoughts on dealing with Gradle, the Gradle daemon, Kotlin daemon, and JVM in general.
- TL;DR
- Gradle for kotlin compiler
- Gradle for other projects
- JVM control
- JMC
- Daemons
- Debugging
- Profiling
- Heap dump
- Benchmarking
TL;DR
Here’s a rundown of the console commands I find myself using the most when dealing with Gradle, Gradle daemon, Kotlin daemon, and JVM.
- build and install Kotlin from sources to local maven repository:
1
./gradlew install - run Kotlin compiler JS IR tests:
1
 ./gradlew --parallel --project-dir js/js.tests jsIrTest
- run Kotlin stdlib JS IR tests:
1
  ./gradlew publish && ./gradlew :kotlin-stdlib:jsNodeTest -Pbootstrap.local=true
- show all available gradle tasks:
1
 ./gradlew -q :tasks --all
- clean everything:
1
 rm -rf .gradle && find . -name 'build' | grep -v ".git" | xargs rm -rf
- show all Kotlin daemons:
1
jps | grep KotlinCompileDaemon - stop all Gradle and Kotlin daemons:
1
 jps | grep -E 'GradleDaemon|KotlinCompileDaemon' | cut -f 1 -d' ' | xargs kill -9
- start Kotlin daemon with debugger server:
1
 ./gradlew -Dkotlin.daemon.jvm.options=-agentlib:jdwp=transport=dt_socket\\,server=y\\,suspend=y\\,address=5006 :${Kotlin JS Task}
- start Kotlin daemon with debugger client:
1
 ./gradlew -Dkotlin.daemon.jvm.options=-agentlib:jdwp=transport=dt_socket\\,server=n\\,address=localhost:5006\\,suspend=y :${Kotlin JS Task}
- start Kotlin daemon with/for JFR:
1
 ./gradlew -Dkotlin.daemon.jvm.options=XX:+UnlockDiagnosticVMOptions,XX:+DebugNonSafepoints,XX:+FlightRecorder,XX:FlightRecorderOptions=stackdepth=2048 :${Kotlin JS Task}
- start JFR:
1
 jcmd ${KotlinCompileDaemon PID} JFR.start name=KotlinDemonProfile filename=/out/path/recording.jfr settings=profile maxsize=4GB
- stop JFR:
1
 jcmd ${KotlinCompileDaemon PID} JFR.stop name=KotlinDemonProfile
- start Kotlin daemon with Heap dump:
1
 ./gradlew -Dkotlin.daemon.jvm.options=XX:+HeapDumpOnOutOfMemoryError,XX:HeapDumpPath=/path/to/heap_dump.hprof :${Kotlin JS Task}
- run gradle-profiler:
1
 gradle-profiler --benchmark --project-dir /path/to/project --scenario-file /path/to/scenario/file.scenarios
Gradle for kotlin compiler
local.properties
My team-mates have strongly recommended me add the following local.properties file to my kotlin local repository
1
2
3
4
5
org.gradle.java.installations.auto-detect=false
kotlin.build.isObsoleteJdkOverrideEnabled=true
kotlin.native.enabled=false
kotlin.build.disable.werror=true
kotlin.test.maxParallelForks=8
Building
Build Kotlin from sources:
1
./gradlew dist
Build Kotlin from sources and install it into local maven repository ($HOME/.m2 directory):
1
./gradlew install
Compiler tests
You can run tests from IDE - just press the green play button, however it is possible to run the tests from the console.
Run all Kotlin/JS tests from the console:
1
./gradlew --parallel --project-dir js/js.tests jsIrTest
Also, you may add -Pfd.kotlin.js.debugMode=2 option to you tests (in IDE it works as well). If this option is enabled, compiler dumps IR after each lowering. They will be dumped to js/js.tests/build/out/irBox/builtins/${testName}-irdump directory. Extremely useful for debugging! 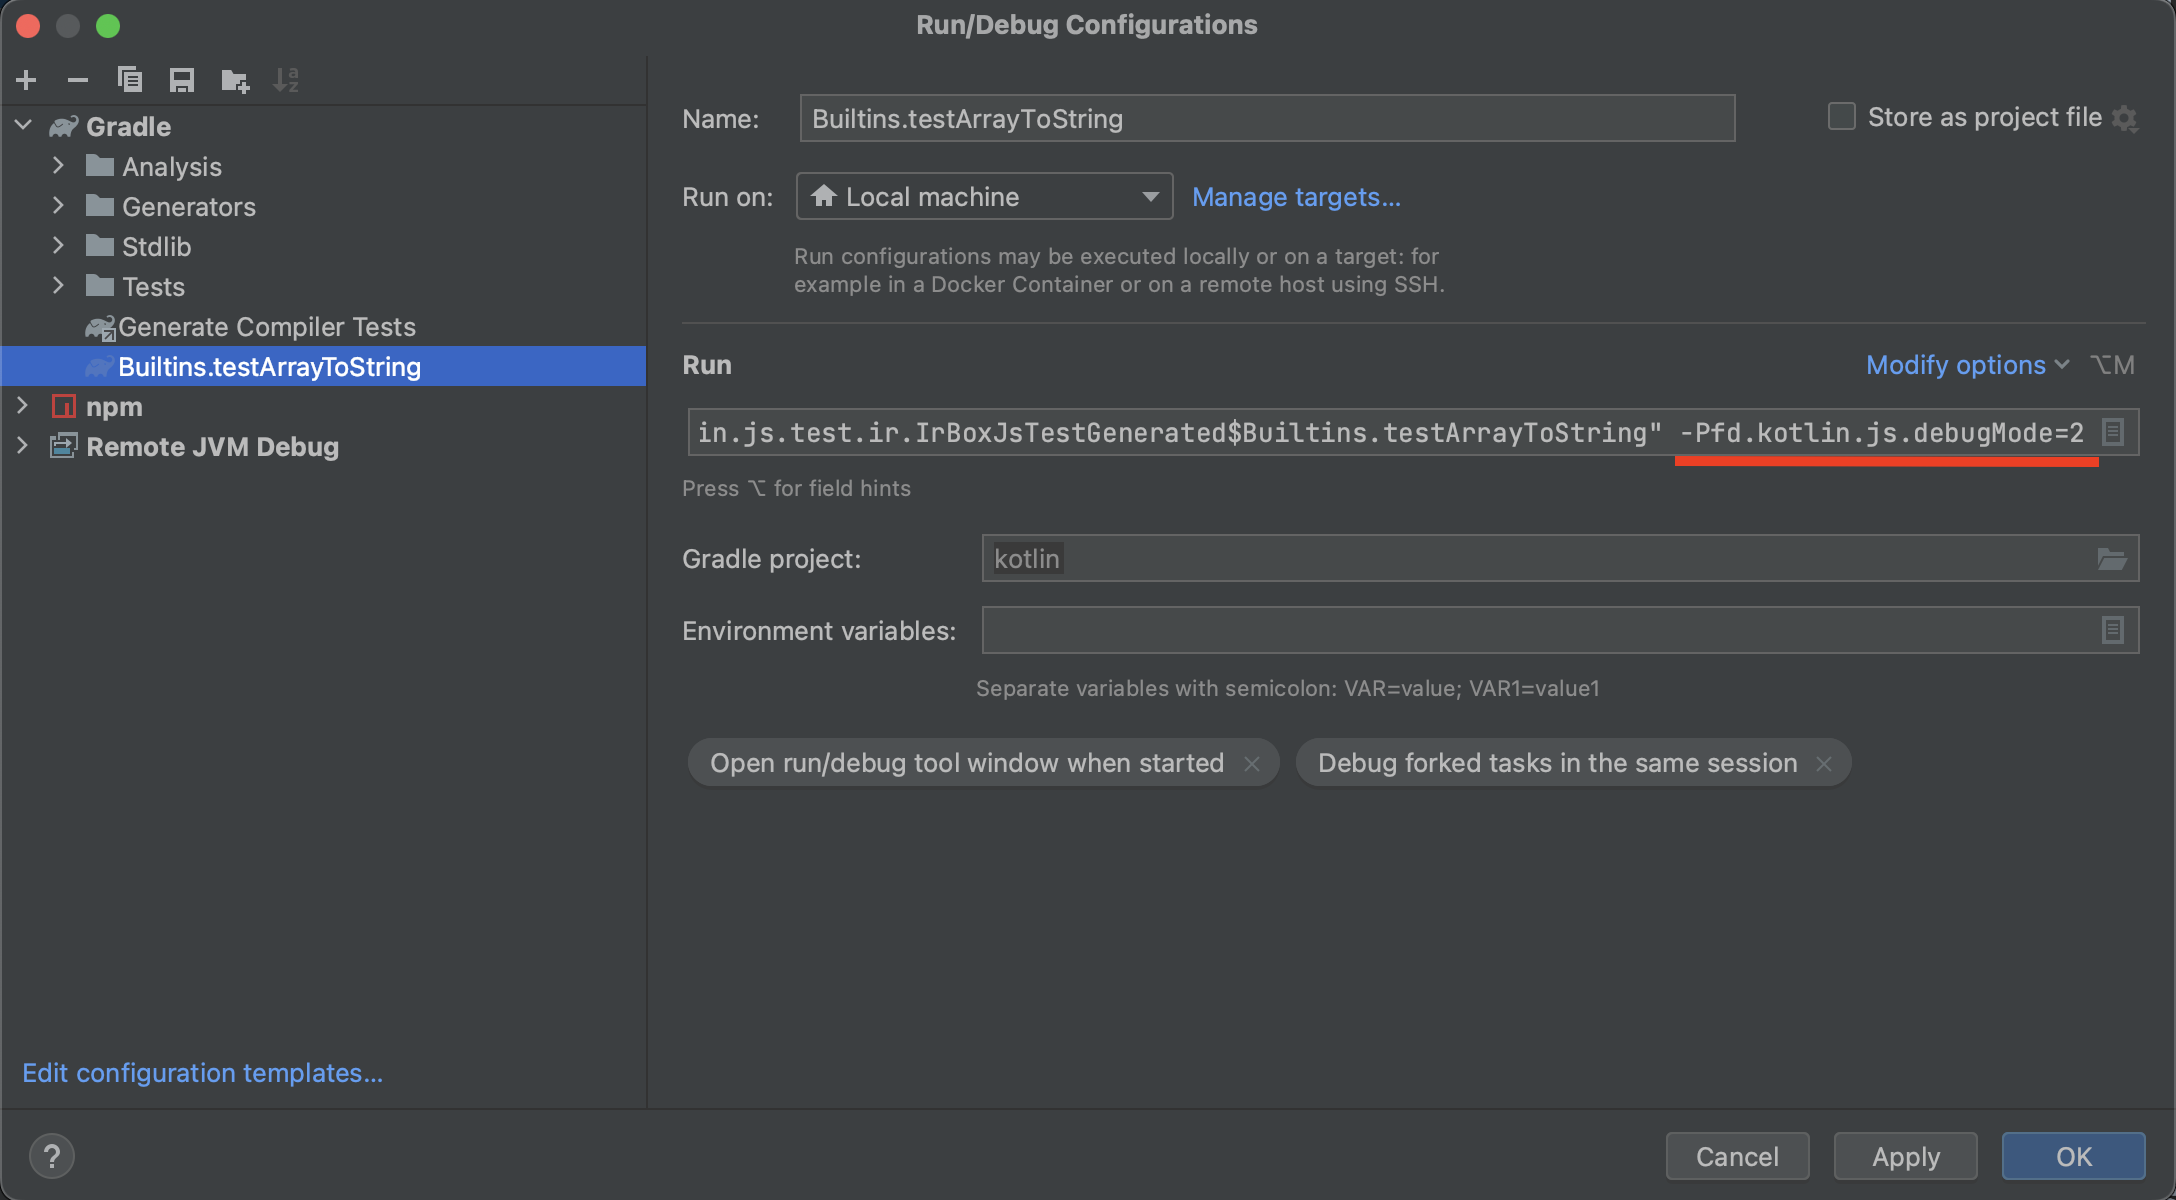
There is another option -Pfd.org.jetbrains.kotlin.compiler.ir.dump.strategy=KotlinLike that makes the IR dump more readable (but less detailed).
A piece of information about Kotlin/JS tests can be found in Kotlin official repository here and here
stdlib tests
Before running the tests, publish stdlib to the local bootstrap
1
./gradlew publish
Run the tests with the local bootstrap (it may work long)
1
./gradlew :kotlin-stdlib:jsNodeTest -Pbootstrap.local=true
Gradle for other projects
Using kotlin from local maven repository
After building and installing kotlin from sources you may use it for building other projects.
For that:
1) Add the following code to the beginning of settings.gradle.kts file:
1
2
3
4
5
6
pluginManagement {
  repositories {
    gradlePluginPortal()
    mavenLocal()
  }
}
2) Go through all build.gradle.kts files and
- add
mavenLocal()near allmavenCentral()calls, it may look like: ```kotlin allprojects { version = “0.1.1”
repositories { mavenLocal() mavenCentral() } }
1
2
3
4
5
6
   - set kotlin and plugin version to `2.X.255-SNAPSHOT`, it may look like:
```kotlin
plugins {
  kotlin("multiplatform") version "2.0.255-SNAPSHOT" apply false
  kotlin("plugin.serialization") version "2.0.255-SNAPSHOT" apply false
}
Passing compiler args
You may pass arguments to the compiler. For that in build.gradle.kts add the following lines:
1
2
3
4
5
tasks.withType<org.jetbrains.kotlin.gradle.dsl.KotlinJsCompile> {
    // use kotlinOptions.freeCompilerArgs for passing additional arguments
    kotlinOptions.freeCompilerArgs += "-Xgenerate-dts"
    kotlinOptions.freeCompilerArgs += "-Xstrict-implicit-export-types"
}
Build your project
99.9% of all the things with gradle you can do from IDE, however you can also use a console.
To increase the compiler output verbosity you may add --info option to the gradle command.
In general there are two types of build:
- Development - no DCE, but it supports incremental compilation,
- Production - with DCE, incremental compilation options are ignored.
The names of the gradle build tasks may be different for each project. You may check the tasks name in IDE (Gradle button in the right top corner), or use the following command:
1
./gradlew -q :tasks --all
Building full-stack-web-jetbrains-night-sample
Development build without DCE, but with the incremental compilation support
1
./gradlew client:compileDevelopmentExecutableKotlinJs
Production build with Webpack(?)
1
./gradlew client:compileProductionExecutableKotlinJs
Gradle clean
If you do not trust ./gradlew clean command, you can remove all build artifacts with the command:
ATTENTION! IT MAY REMOVE MORE THAN YOU WANT! DO NOT USE THIS COMMAND IN KOTLIN LOCAL REPOSITORY
1
rm -rf .gradle && find . -name 'build' | grep -v ".git" | xargs rm -rf
JVM control
Here are the most useful JVM commands which allows controlling your daemons.
jps
This command shows all JVM processes. I usually use it with grep.
Example:
1
jps
jcmd
This is a very nice tool, it helps to understand what is going on with Kotlin daemon. Read more here.
The most interesting are: VM.uptime, VM.flags, VM.system_properties, VM.command_line, JFR.*.
Example:
1
jcmd ${PID} VM.uptime
JMC
Must have tool! You can find it here.
It allows you to control and monitor the resources of your daemons: 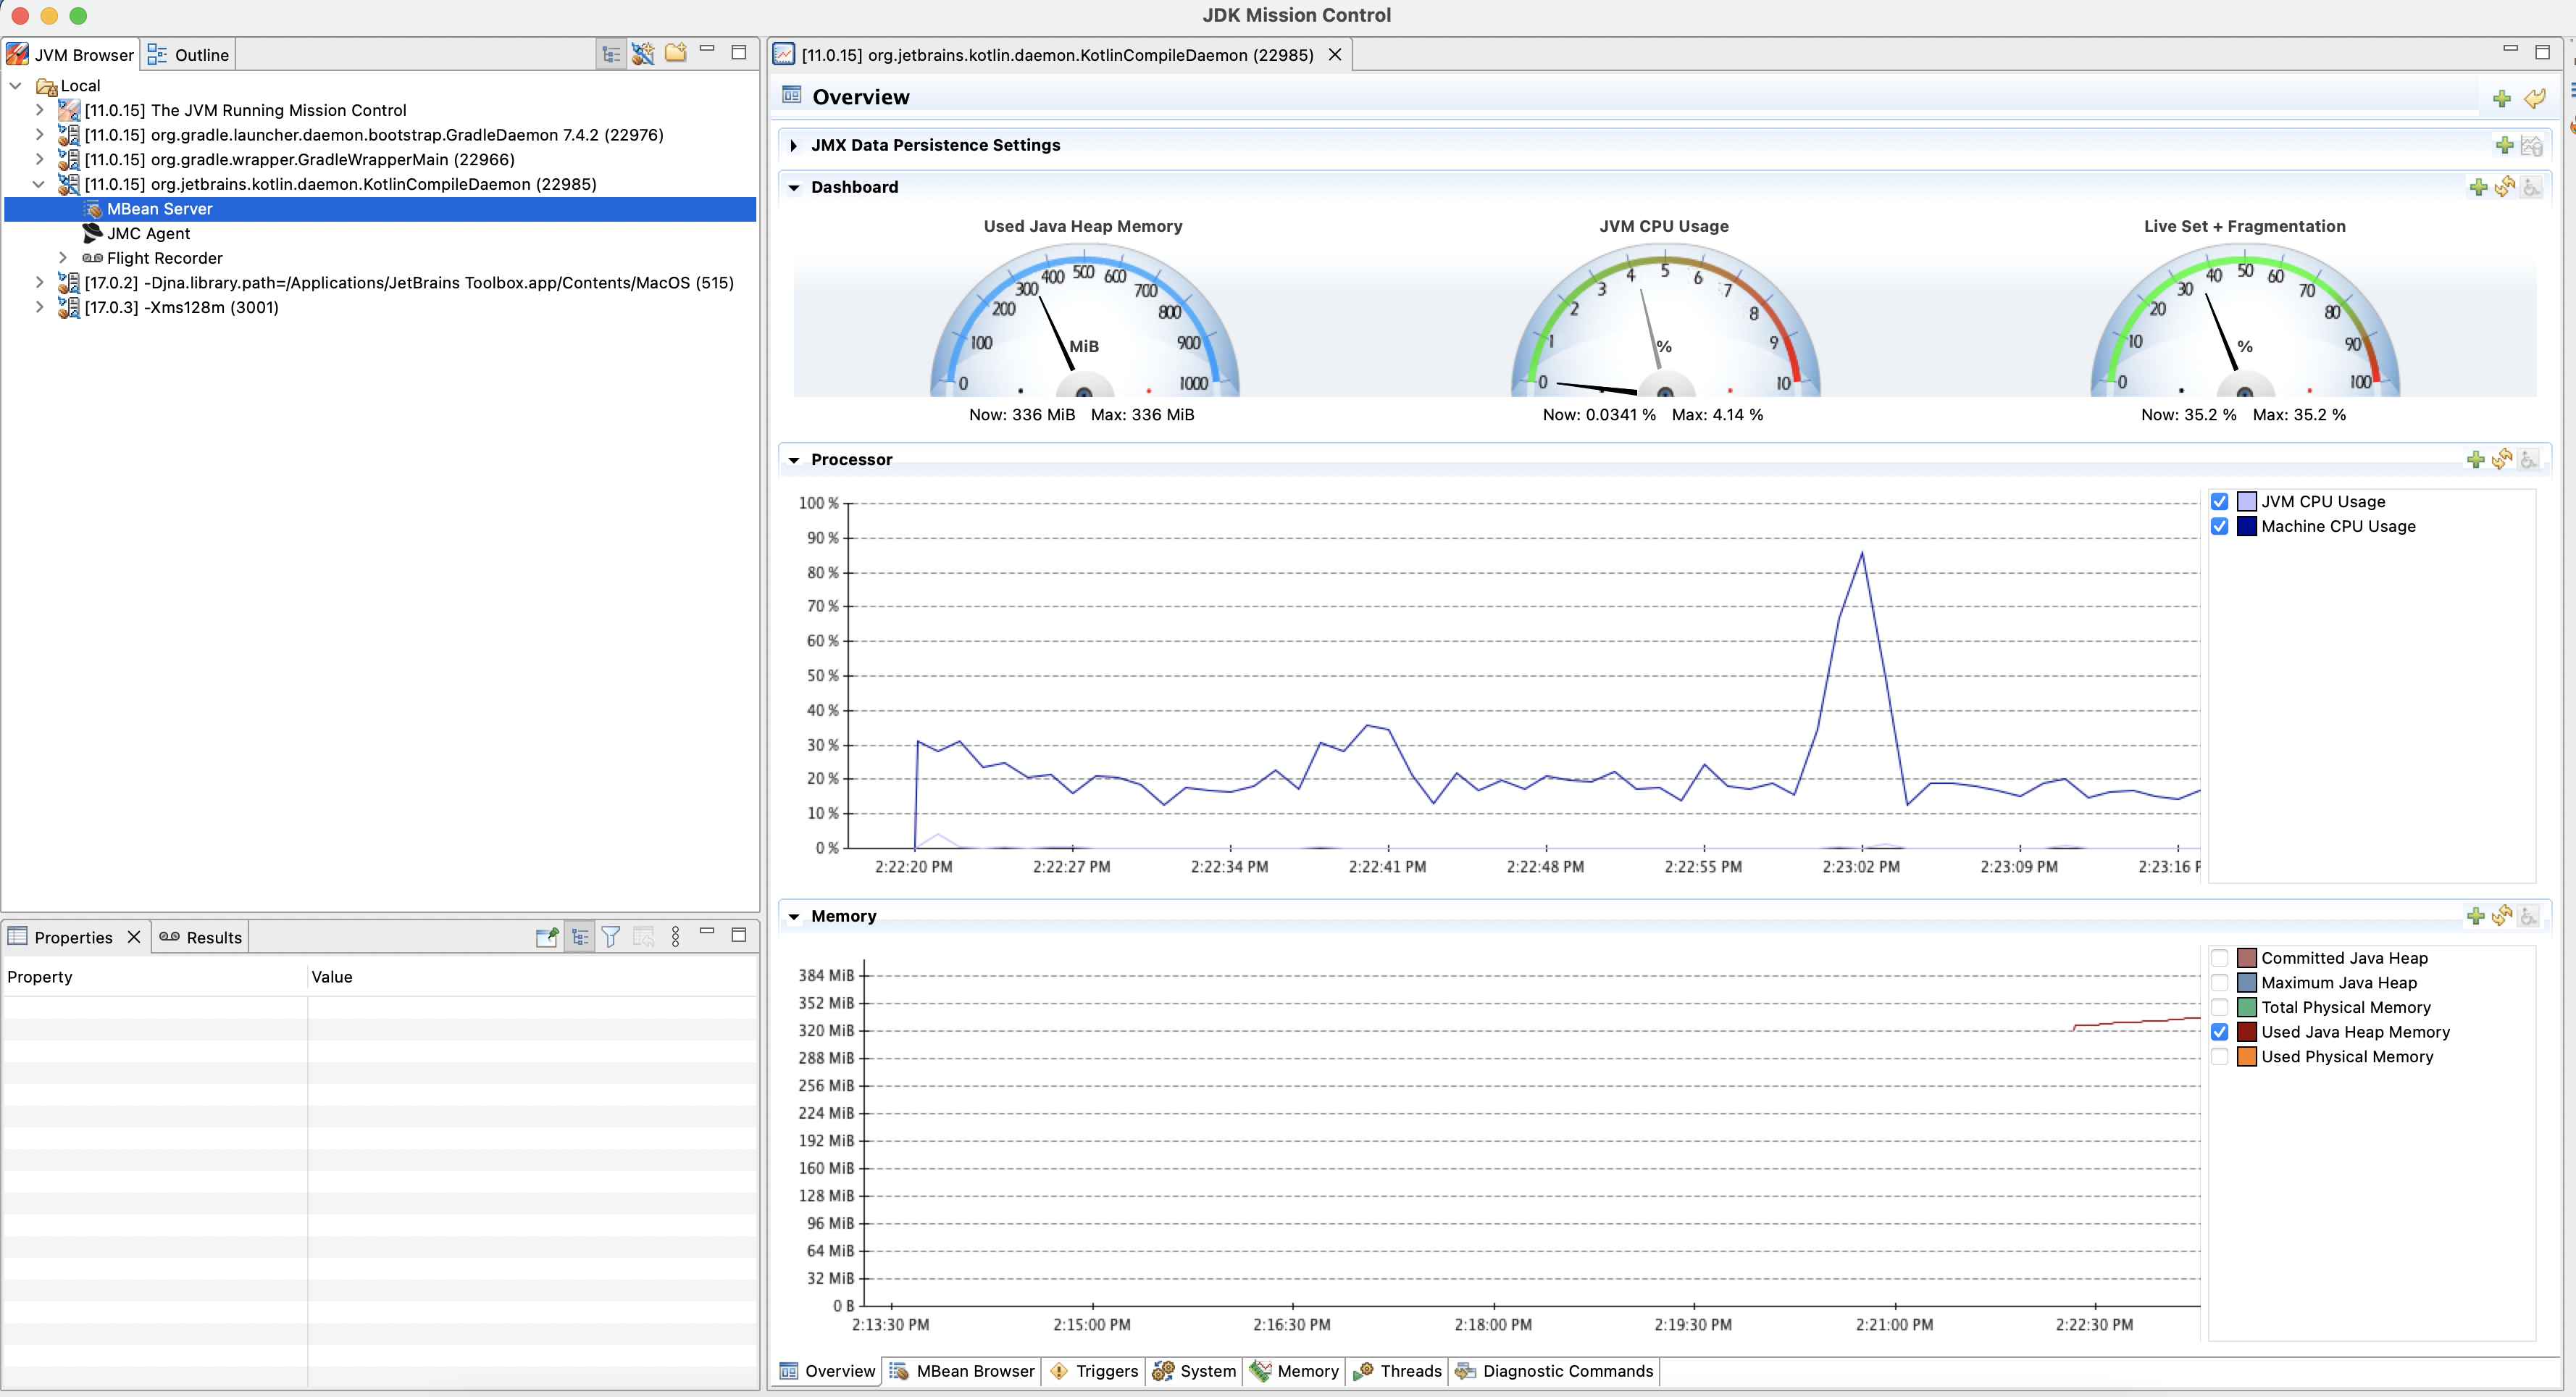
Also, it may run jcmd commands from the UI: 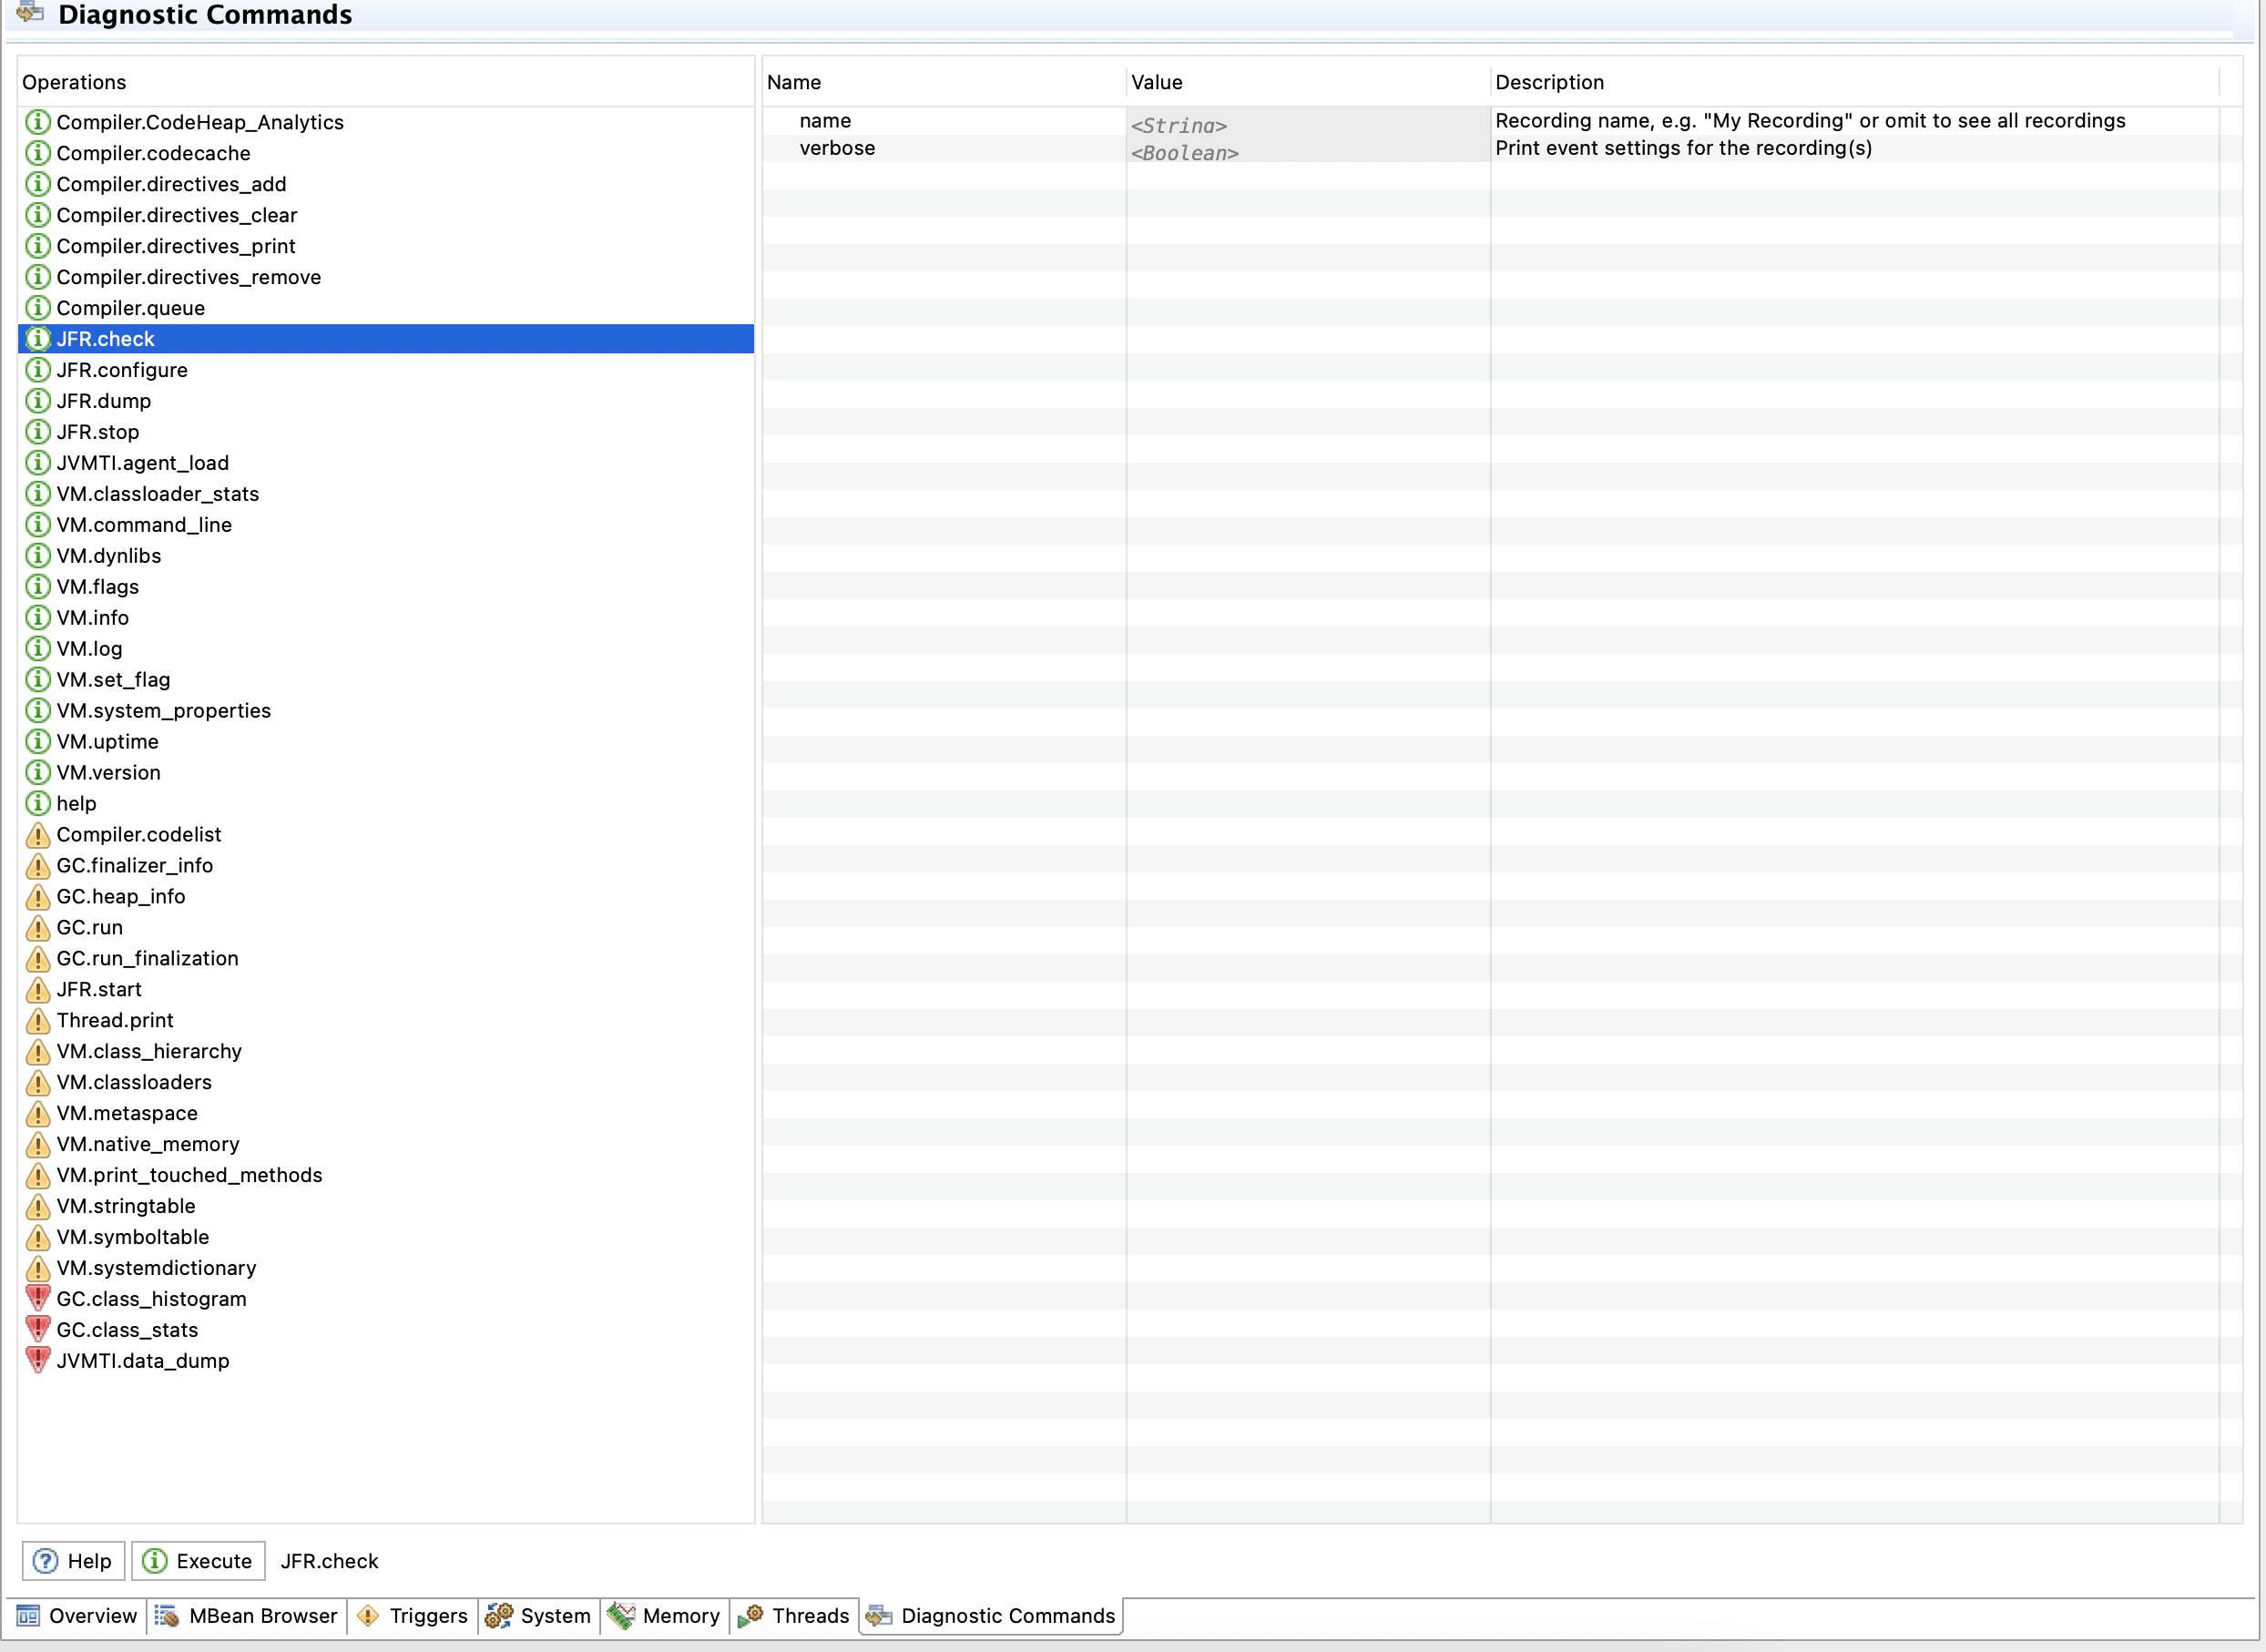
And other helpful things.
Daemons
You can say gradle to run everything in one process without daemons, but it is very slow! If you still wanna do this, check the options (in gradle.properties or local.properties or through -P{option key}={option value}):
org.gradle.daemon=false- do not start gradle daemon,kotlin.compiler.execution.strategy=in-process- do not start Kotlin daemon.
Usually gradle stars GradleDaemon which starts KotlinCompileDaemon, and this daemon does all Kotlin stuff.
Mostly you need to pass some extra options to Kotlin daemon, but before you need to find and stop him, so the next time Gradle daemon will start Kotlin daemon with your options.
Searching daemons
Find Kotlin daemon PID:
1
jps | grep KotlinCompileDaemon
Q: What should I do if I see more than one KotlinCompileDaemon processes?
A: Usually I clean everything, stop all daemons and run build task again. If after that I still see more than one daemon, I use the daemon with the highest PID.
Find Gradle and Kotlin daemons:
1
jps | grep -E 'GradleDaemon|KotlinCompileDaemon'
Stopping daemons
Stop all daemon processes:
1
jps | grep -E 'GradleDaemon|KotlinCompileDaemon' | cut -f 1 -d' ' | xargs kill -9
Also, you may stop all JVM processes (it works fine for macOS, however on Linux it may kill your IDE as well):
1
killall -9 java
Passing project options to Gradle daemon
You may add or override option from gradle.properties or local.properties via -P. For example, enable JS IR backend:
1
./gradlew -Pkotlin.js.compiler=ir :${Kotlin JS Task}
Passing JVM options to Gradle daemon
These kind of options can be passed via flag -D. For example give 4G memory for the daemon:
1
./gradlew -Dorg.gradle.jvmargs=-Xmx4g
Passing options to Kotlin daemon JVM
You may pass options to Kotlin daemon JVM via kotlin.daemon.jvm.options (and -D!!!):
1
./gradlew -Dkotlin.daemon.jvm.options=${any options separated by `,` without `-`} :${Kotlin JS Task}
Debugging
IDE as a client and Kotlin or Gradle daemon as a server
In this case IDE with the debugger client connects to Kotlin or Gradle daemon JVM server.
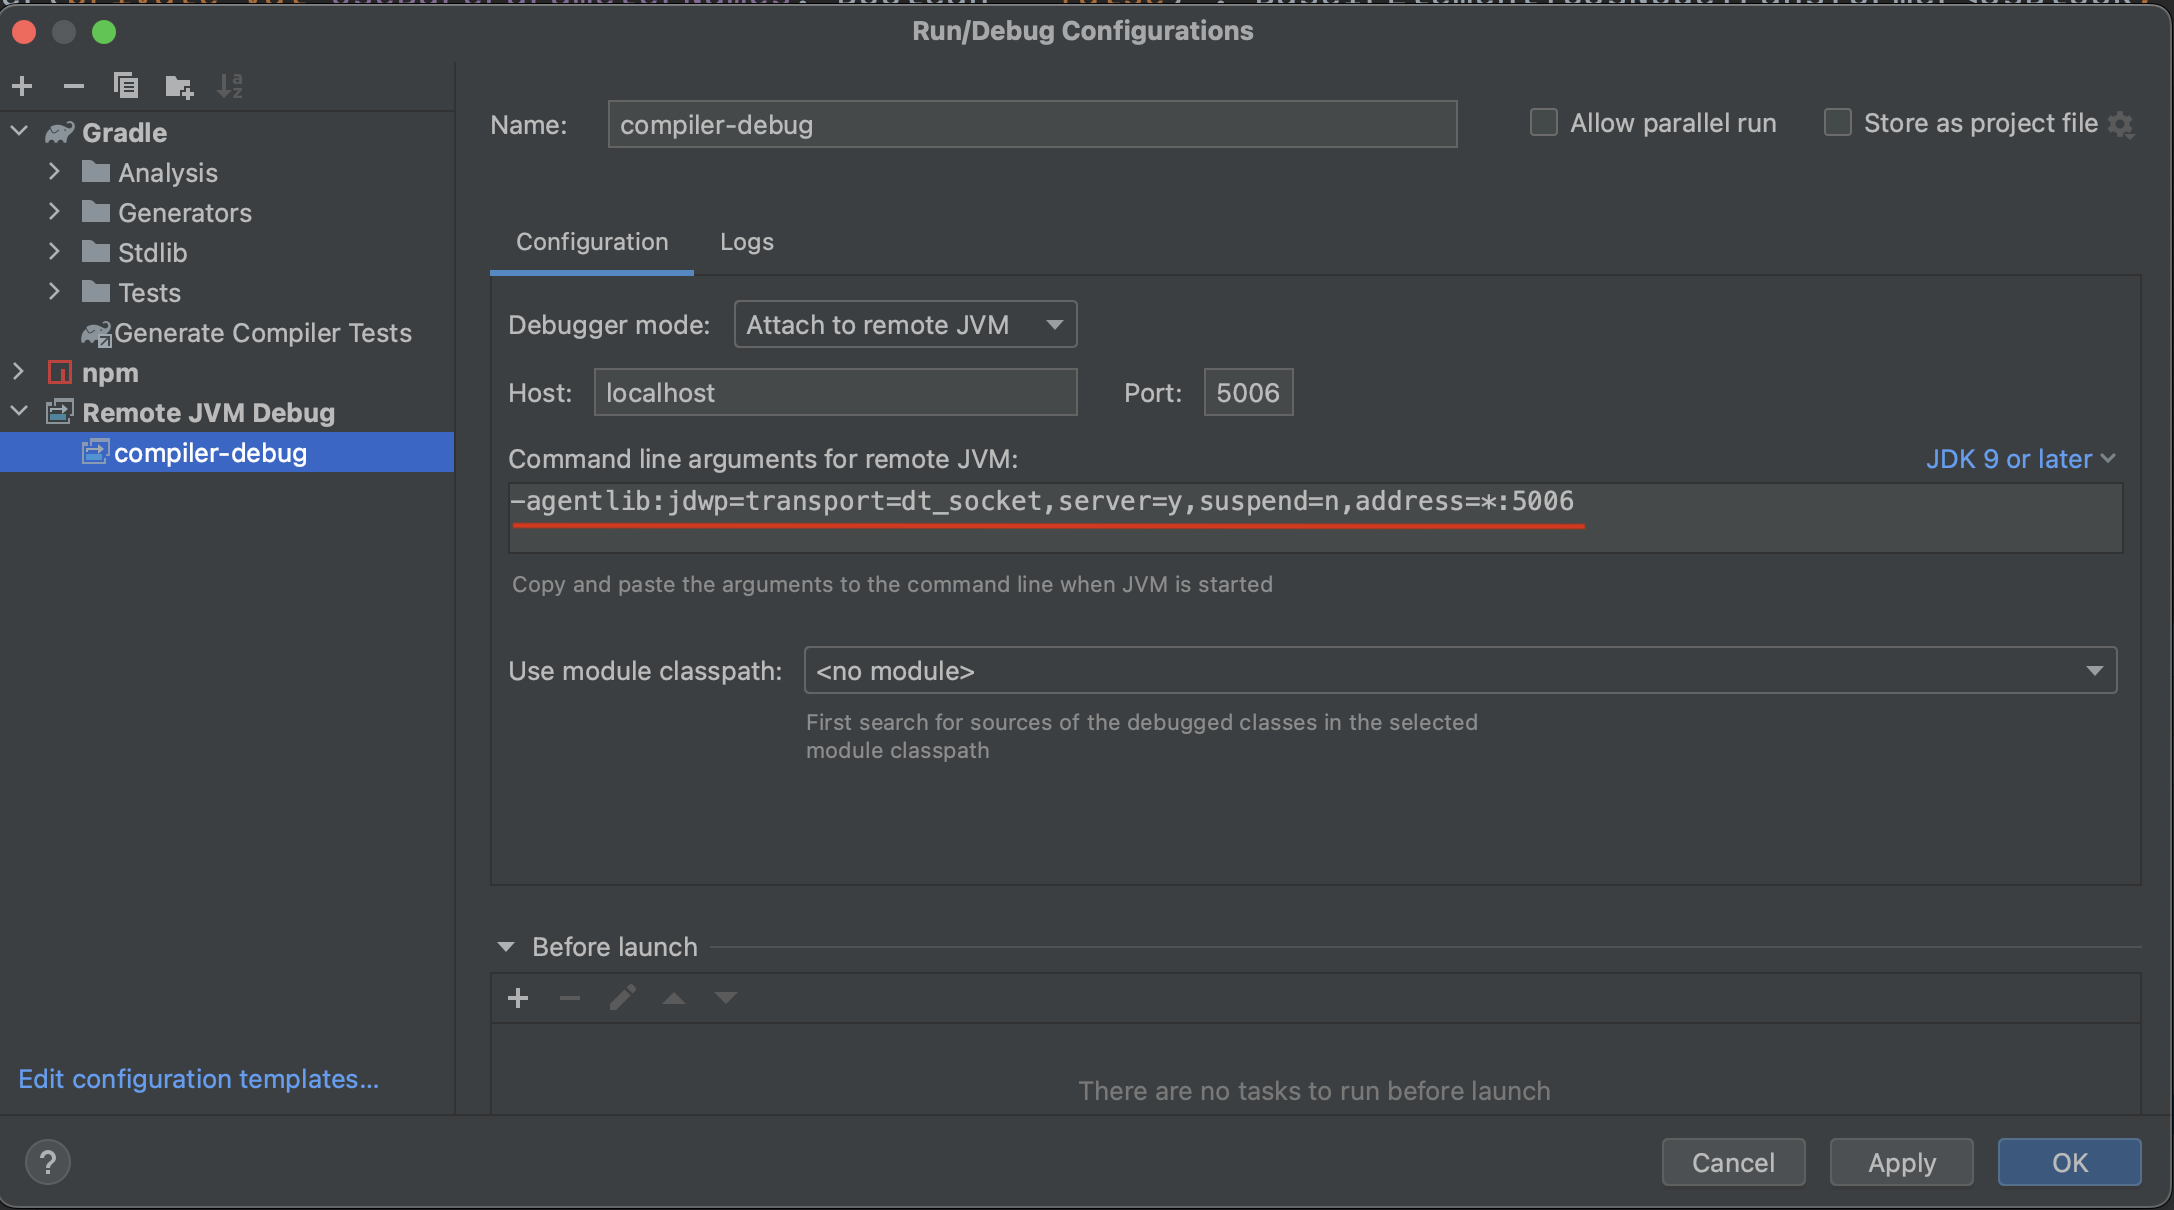
- Prepare a debug configuration in IDE, it should look like that:
- Before continuing make sure, that there are no available daemons.
- Do not forget about breakpoints.
Start the daemon with the following JVM options (these options must correspond to the options from the debug config):
If you wanna debug Gradle daemon:
1
 ./gradlew -Dorg.gradle.jvmargs=-agentlib:jdwp=transport=dt_socket,server=y,suspend=y,address=5006 :${Kotlin JS Task}
If you wanna debug Kotlin daemon:
1
 ./gradlew -Dkotlin.daemon.jvm.options=-agentlib:jdwp=transport=dt_socket\\,server=y\\,suspend=y\\,address=5006 :${Kotlin JS Task}
- Go to IDE and connect with remove debugger to the daemon.
- Wait the breakpoint trigger.
- Enjoy!
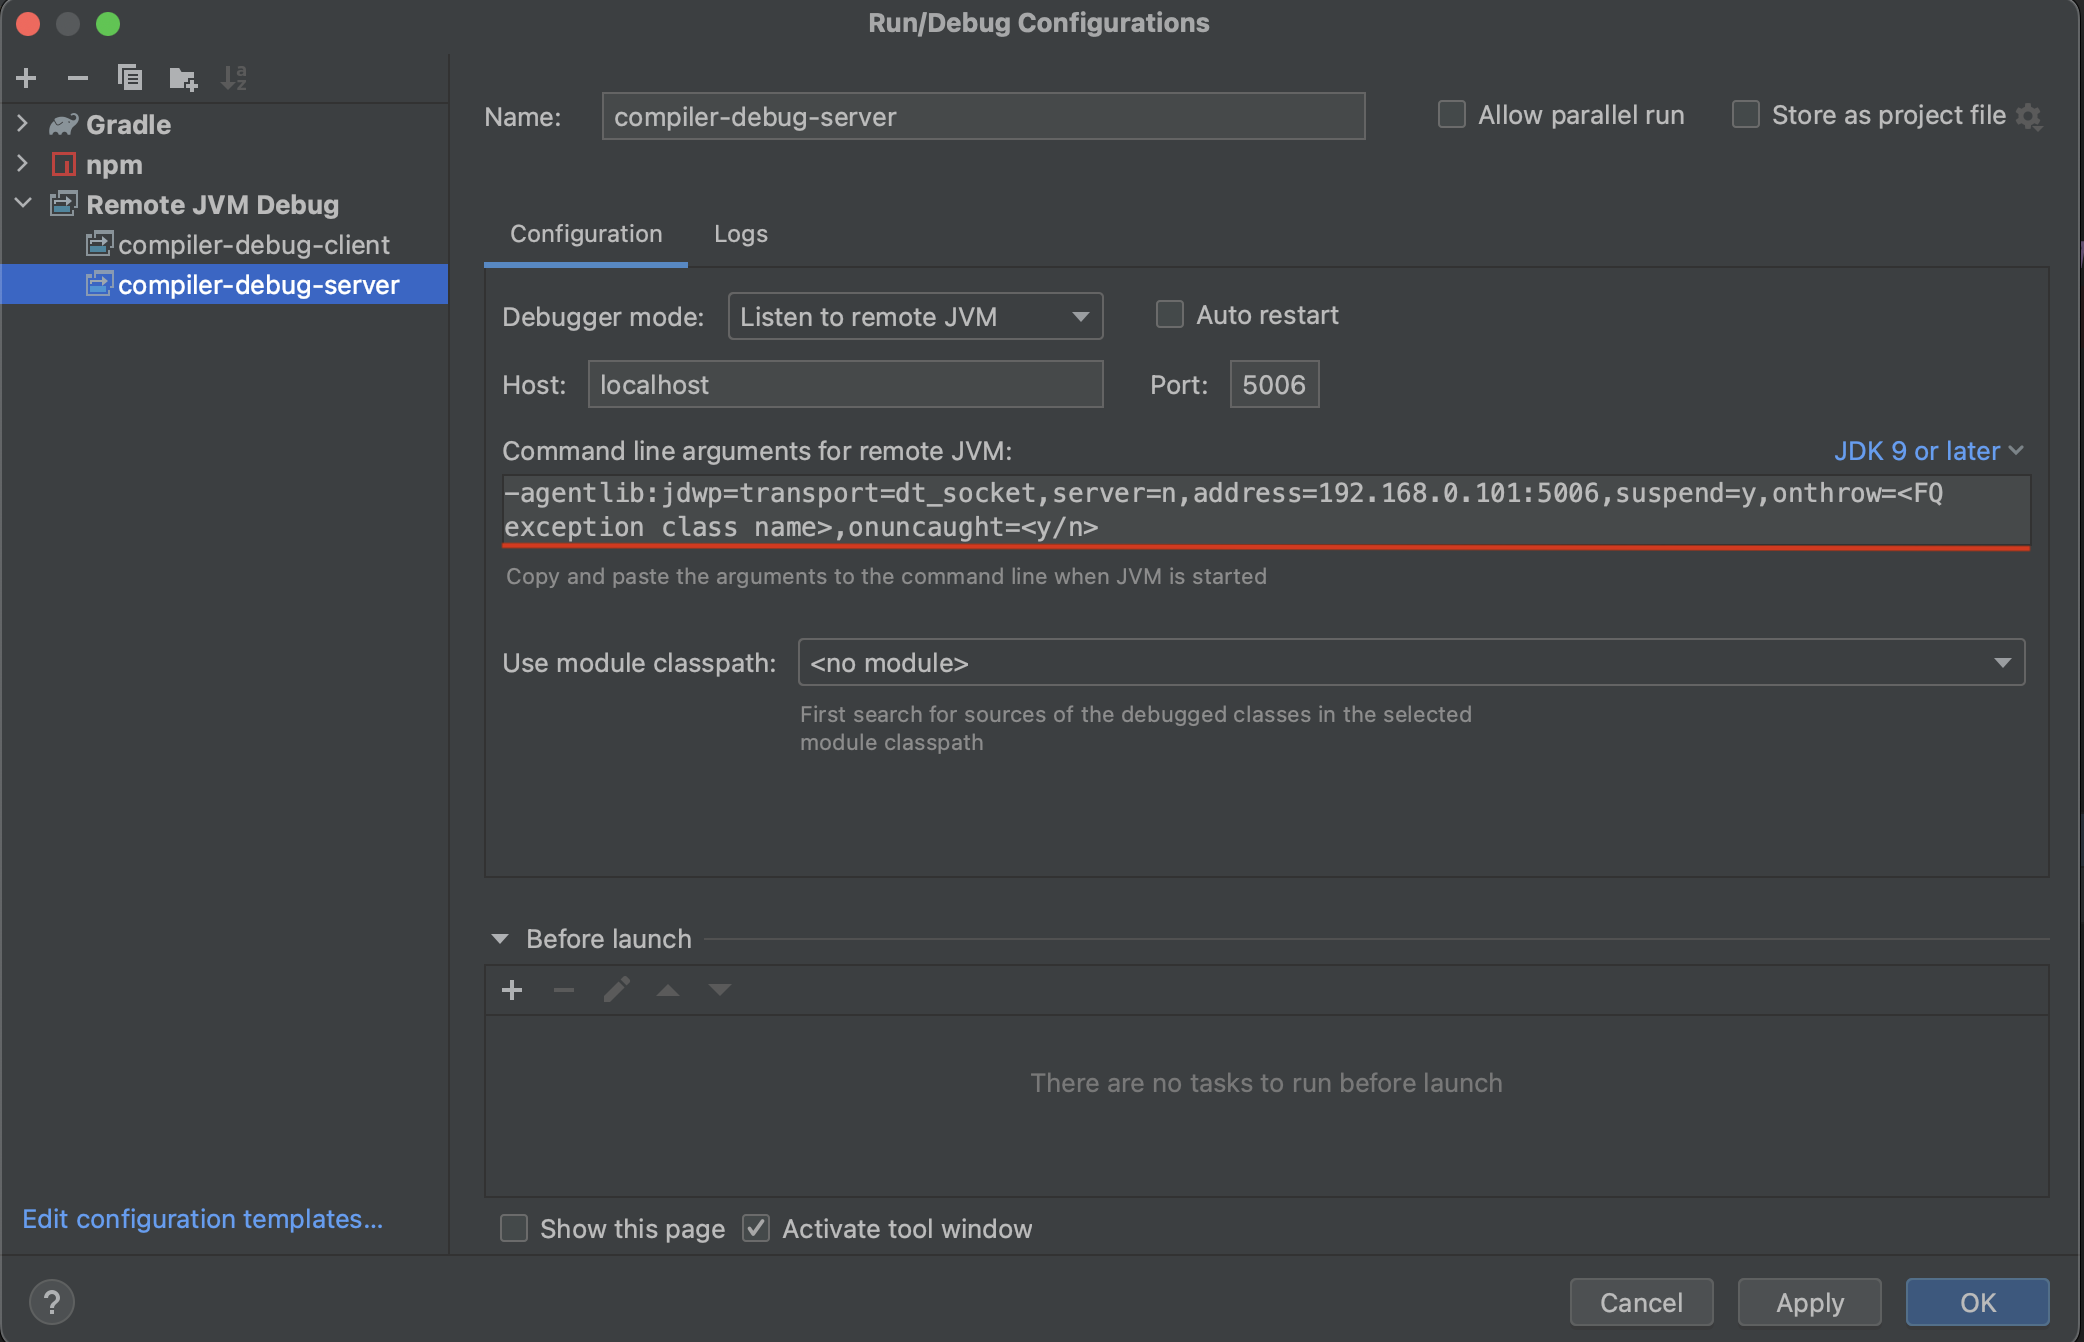
IDE as a server and Kotlin or Gradle daemon as a client
In this case Kotlin or Gradle daemon JVM client connects to IDE with the debugger server.
- Prepare a debug configuration in IDE, it should look like that:
- Before continuing make sure, that there are no available daemons.
- From IDE start listing a debugger connection.
- Do not forget about breakpoints.
Start the daemon with the following JVM options (these options must correspond to the options from the debug config):
If you wanna debug Gradle daemon:
1
 ./gradlew -Dorg.gradle.jvmargs=-agentlib:jdwp=transport=dt_socket,server=n,address=localhost:5006,suspend=y :${Kotlin JS Task}
If you wanna debug Kotlin daemon:
1
 ./gradlew -Dkotlin.daemon.jvm.options=-agentlib:jdwp=transport=dt_socket\\,server=n\\,address=localhost:5006\\,suspend=y :${Kotlin JS Task}
Note: You may use either the ip address (in the example it is 192.168.0.101) from the IDE config or just localhost, both work fine. I also remove
onthrowandonuncaughtoptions, however in some cases they can be useful.- Wait the breakpoint trigger.
- Enjoy!
Note: All , for Kotlin daemon must be escape with two slashes \\,.
Profiling
Attaching from IDE
Works like a magic: just open Profiler tab, find you KotlinCompileDaemon process and attach.
If you can’t find Profiler tab for some reasons - open Actions (for macOS: Command + Shift + A) and enter Profiler 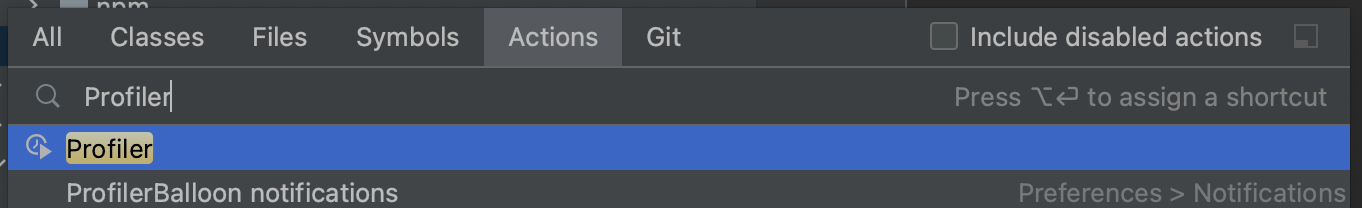
Java flight recorder complains about stack depth, therefore it makes sense to tune and use it manually.
Java flight recorder
Tune JFR for Kotlin daemon (Before starting make sure, that there are no available Kotlin daemons):
1
./gradlew -Dkotlin.daemon.jvm.options=XX:+UnlockDiagnosticVMOptions,XX:+DebugNonSafepoints,XX:+FlightRecorder,XX:FlightRecorderOptions=stackdepth=2048 :${Kotlin JS Task}
+UnlockDiagnosticVMOptionsand+DebugNonSafepoints- in the internet it is written, that this options improve the profiling quality, I have no idea if it is true.+FlightRecorder- enable JFR (not sure if the option should be explicitly used).FlightRecorderOptions- tune JFR, set stack depth. This option is must have!
Do not forget about JVM warming up!
Start-stop JFR:
1
2
3
jcmd ${KotlinCompileDaemon PID} JFR.start name=KotlinDemonProfile filename=/out/path/recording.jfr settings=profile maxsize=4GB
# do the compilation
jcmd ${KotlinCompileDaemon PID} JFR.stop name=KotlinDemonProfile
You can use this combination for small projects:
1
2
3
jcmd ${KotlinCompileDaemon PID} JFR.start name=KotlinDemonProfile filename=/out/path/recording.jfr settings=$JAVA_HOME/lib/jfr/profile.jfc maxsize=4GB && \
  ./gradlew -Dkotlin.daemon.jvm.options=XX:+UnlockDiagnosticVMOptions,XX:+DebugNonSafepoints,XX:+FlightRecorder,XX:FlightRecorderOptions=stackdepth=2048 :${Kotlin JS Task} && \
  jcmd ${KotlinCompileDaemon PID} JFR.stop name=KotlinDemonProfile
Links:
Heap dump
OOM investigation
If you wanna figure out what’s going wrong and why the compiler decided to munch on all the memory, you gotta ask the JVM to spit out a heap dump when it’s OOM time.
Check the default JVM args
But before, inspect the current JVM args, it is very possible, that required options are already passed implicitly. You can do this with the jcmd command:
1
jcmd ${KotlinCompileDaemon PID} VM.command_line
I’ve got the following:
1
2
3
4
5
6
7
8
9
jvm_args:
  -Djava.awt.headless=true
  -D$java.rmi.server.hostname=127.0.0.1
  -Xmx4g
  -XX:MaxMetaspaceSize=768m
  -Dkotlin.environment.keepalive
  -ea
  -XX:+HeapDumpOnOutOfMemoryError
  -XX:HeapDumpPath=/var/folders/wf/6rs371f93c33q3kl3ygxs4500000kt/T/
so I can find heap dumps in /var/folders/wf/6rs371f93c33q3kl3ygxs4500000kt/T/ directory:
1
ls -la /var/folders/wf/6rs371f93c33q3kl3ygxs4500000kt/T/ | grep java
a heap dump should look like java_pid${KotlinCompileDaemon PID}.hprof.
Pass JVM args explicitly
If HeapDumpOnOutOfMemoryError and HeapDumpPath are not specified implicitly, you can pass them explicitly to Kotlin daemon (before starting make sure, that there are no available Kotlin daemons):
1
./gradlew -Dkotlin.daemon.jvm.options=XX:+HeapDumpOnOutOfMemoryError,XX:HeapDumpPath=/path/to/heap_dump.hprof :${Kotlin JS Task}
Manually
Also heap dump can be generated manually via jcmd:
1
jcmd ${KotlinCompileDaemon PID} GC.heap_dump /path/to/heap_dump.hprof
Programmatically
Ready to use code snippet:
1
2
3
4
5
6
7
8
9
10
11
12
13
14
import com.sun.management.HotSpotDiagnosticMXBean
import java.lang.management.ManagementFactory

object HeapDumper {
    private val hotSpotDiagnostic: HotSpotDiagnosticMXBean by lazy {
        val connection = ManagementFactory.getPlatformMBeanServer()
        val name = "com.sun.management:type=HotSpotDiagnostic"
        ManagementFactory.newPlatformMXBeanProxy(connection, name, HotSpotDiagnosticMXBean::class.java)
    }

    fun createHeapDump(file: String, live: Boolean) {
        hotSpotDiagnostic.dumpHeap(file, live)
    }
}
Links
Benchmarking
Gradle profiler is good for benchmarking, however I’m still not sure if it is possible to use it for Kotlin daemon profiling, because it runs profilers only for Gradle daemon and profiles them.
Legacy vs IR vs IR + IC scenarios
Here is a template. Feel free to copy-paste-modify it. Do not forget to set ${Kotlin JS Task}. Also, you may wanna add extra gradle-args options, like --info or tune JVM arguments via jvm-args.
1
2
3
4
5
6
7
8
9
10
11
12
13
14
15
16
17
18
19
20
21
22
23
24
25
26
27
28
29
30
31
32
33
34
35
36
37
38
39
40
41
42
43
44
45
46
47
48
49
50
51
52
53
54
55
56
57
58
59
60
61
clean_build_legacy {
    title = "Legacy: clean build"
    tasks = [":${Kotlin JS Task}"]
    cleanup-tasks = ["clean"]
    gradle-args = [
        "-Pkotlin.js.compiler=legacy",
    ]
    jvm-args = [
        "-Xmx6g",
        "-XX:+UseParallelGC"
    ]
    clear-build-cache-before = SCENARIO
    clear-configuration-cache-state-before = SCENARIO
    clear-transform-cache-before = SCENARIO
    clear-project-cache-before = SCENARIO
    show-build-cache-size = true
    iterations = 4
    warm-ups = 2
}
clean_build_ir {
    title = "IR: clean build"
    tasks = [":${Kotlin JS Task}"]
    cleanup-tasks = ["clean"]
    gradle-args = [
        "-Pkotlin.js.compiler=ir",
        "-Pkotlin.incremental.js.klib=false",
        "-Pkotlin.incremental.js.ir=false"
    ]
    jvm-args = [
        "-Xmx6g",
        "-XX:+UseParallelGC"
    ]
    clear-build-cache-before = SCENARIO
    clear-configuration-cache-state-before = SCENARIO
    clear-transform-cache-before = SCENARIO
    clear-project-cache-before = SCENARIO
    show-build-cache-size = true
    iterations = 4
    warm-ups = 2
}
clean_build_ir_ic {
    title = "IR IC: clean build"
    tasks = [":${Kotlin JS Task}"]
    cleanup-tasks = ["clean"]
    gradle-args = [
        "-Pkotlin.js.compiler=ir",
        "-Pkotlin.incremental.js.klib=true",
        "-Pkotlin.incremental.js.ir=true"
    ]
    jvm-args = [
        "-Xmx6g",
        "-XX:+UseParallelGC"
    ]
    clear-build-cache-before = SCENARIO
    clear-configuration-cache-state-before = SCENARIO
    clear-transform-cache-before = SCENARIO
    clear-project-cache-before = SCENARIO
    show-build-cache-size = true
    iterations = 4
    warm-ups = 2
}
You may run benchmarking with the following command:
1
gradle-profiler --benchmark --project-dir /path/to/project --scenario-file /path/to/scenario/file.scenarios